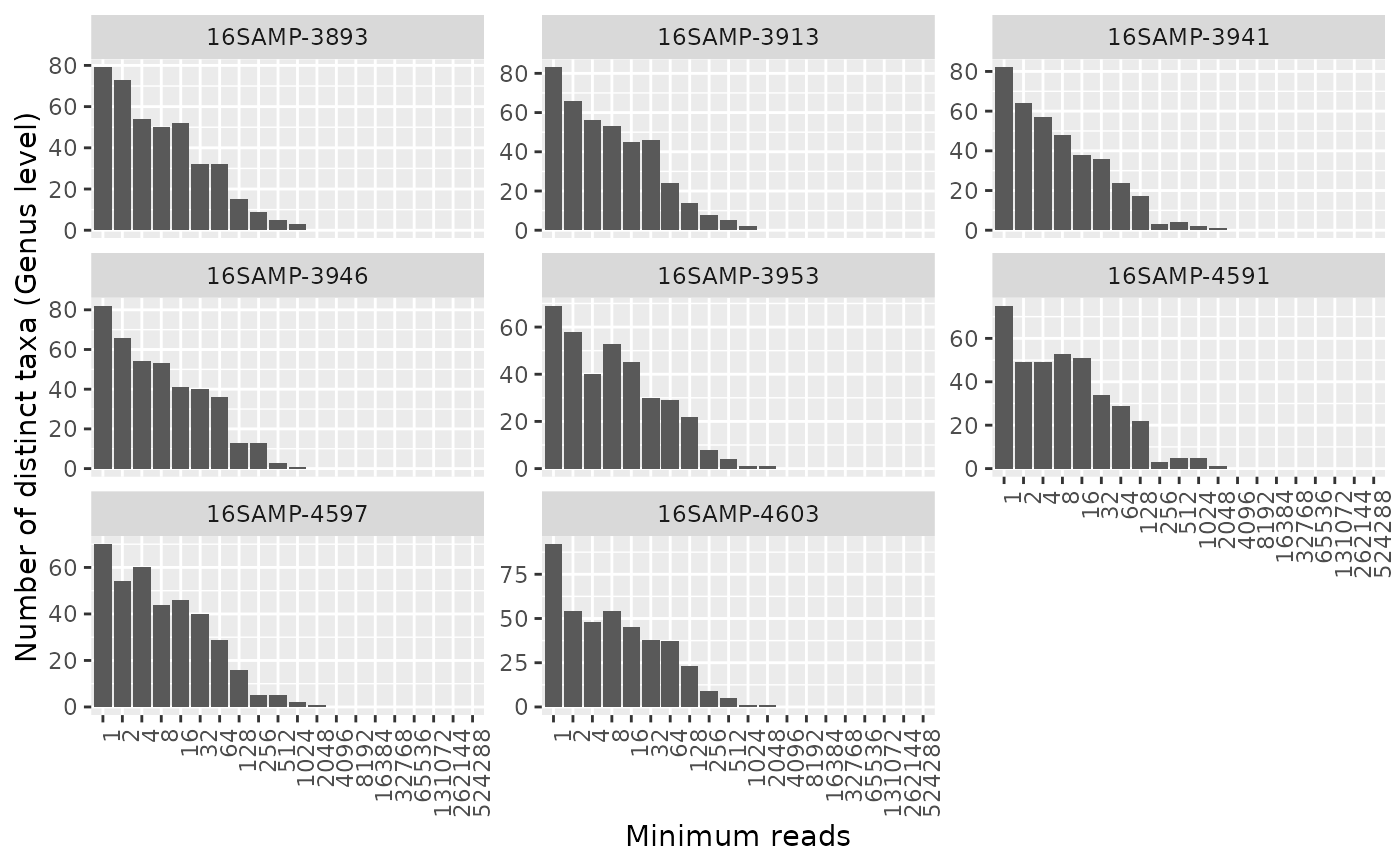
Generates an octave plot to assess alpha diversity. An octave plot is a histogram of the number of taxa observed by bins of read counts, where the bin ranges increase exponentially, see details.
amp_octave(
  data,
  tax_aggregate = "OTU",
  group_by = 1L,
  scales = "fixed",
  num_threads = parallel::detectCores() - 2L
)
Arguments
- data
(required) Data list as loaded with
amp_load.- tax_aggregate
Aggregate (sum) OTU's to a specific taxonomic level initially. OTU's that have not been assigned at the chosen level will be removed with a message. (default:
"OTU")- group_by
Group the samples based on a categorical/discrete variable in the metadata. It is recommended to look at samples individually. Can be a character vector with variable names as-is or a numerical vector with variable positions in the metadata of any length. Set to
NULLfor grouping all samples together (not recommended). (default:1)- scales
If
group_byis set, should the axis scales of each subplot be fixed (fixed), free ("free"), or free in one dimension ("free_x"or"free_y")? (default:"fixed")- num_threads
Maximum number of distinct groups as defined by
group_byto process simultaneously using multicore processors. Only used ifgroup_byis set and there are more than one distinct group in the given variable(s). Default is the number of available cores minus 1.
Value
A ggplot2 object
Details
The \(n\)th bin in the histogram has the range \(r(n)=2^n...2^{n+1}-1\). The height of the bars then reflect the number of unique taxa with read counts in each bin. By judging the distribution one can assess whether the samples have been sequenced deeply enough at the chosen taxonomic level. A full symmetrical bell-shaped distribution with the left part far from the y-axis is the ideal. A high amount of OTU's with a low amount of reads indicates noise, chimeras, and even cross talk.
Aggregating OTU's using tax_aggregate is useful to assess whether the samples
have been sequenced deep enough to capture the full diversity at the given level, but
ONLY applies to OTU's that have assigned taxonomy at the given level.
It is recommended to look at samples individually as grouping samples will almost always look ideal. It is better to identify "bad" samples individually and remove them.
See also
Examples
# Load example data
data("AalborgWWTPs")

# Subset data
ds <- amp_filter_samples(AalborgWWTPs, Year %in% 2014)
#> 59 samples and 4342 OTUs have been filtered
#> Before: 67 samples and 9430 OTUs
#> After: 8 samples and 5088 OTUs

# Generate an octave plot of all samples at Genus level. Adjust num_threads to
# process multiple groups simultaneously using multicore processing
amp_octave(ds,
  group_by = "SampleID",
  tax_aggregate = "Genus",
  scales = "free_y",
  num_threads = 1
)
#> 2080 OTUs (out of 5088) with no assigned taxonomy at Genus level were removed before aggregating OTUs