Calculate alpha-diversity indices for each sample and combines with the metadata.
amp_alphadiv(
  data,
  measure = NULL,
  richness = FALSE,
  rarefy = NULL,
  plot = FALSE,
  plot_scatter = FALSE,
  plot_group_by = NULL
)

amp_alpha_diversity(
  data,
  measure = NULL,
  richness = FALSE,
  rarefy = NULL,
  plot = FALSE,
  plot_scatter = FALSE,
  plot_group_by = NULL
)
Arguments
- data
(required) Data list as loaded with
amp_load.- measure
Alpha-diversity measure(s) to be included if not all. A vector of one or more of:
"uniqueotus""shannon""simpson""invsimpson"
- richness
(logical) Also calculate sample richness estimates (Chao1 and ACE) as calculated by
estimateR. (default:FALSE)- rarefy
Rarefy species richness to this value before calculating alpha diversity and/or richness. Passed directly as the
sampleargument torrarefy. (default:NULL)- plot
(logical) Produce a boxplot instead of a table. (default:
FALSE)- plot_scatter
(logical) If
TRUEproduce a scatter plot instead of a boxplot. (default:FALSE)- plot_group_by
Group the samples by a categorical variable in the metadata. If
NULLthen all samples are shown in a single group.
Value
A data frame or a ggplot if plot is set to TRUE
Details
The alpha-diversity indices are calculated per sample using the vegan function diversity, where the read abundances are first rarefied using rrarefy by the size of the rarefy argument. Refer to the vegan documentation for details about the different indices and how they are calculated. If no measure(s) are chosen, all diversity indices will be returned.
References
McMurdie, P.J. & Holmes, S. (2014). Waste not, want not: Why
rarefying microbiome data is inadmissible. PLoS Comput Biol
10(4): e1003531. DOI:10.1371/journal.pcbi.1003531
See also
Examples
# Load example data
data("AalborgWWTPs")
# Subsample/rarefy to 20000 reads and then calculate
# Shannon and Simpson alpha-diversity indices
alphadiversityresult <- amp_alphadiv(
AalborgWWTPs,
measure = c("shannon", "simpson"),
rarefy = 20000
)
#> The following sample(s) have not been rarefied (less than 20000 reads):
#> 16SAMP-703, 16SAMP-739, 16SAMP-10907
# Explore the results in the data frame
# View(alphadiversityresult)
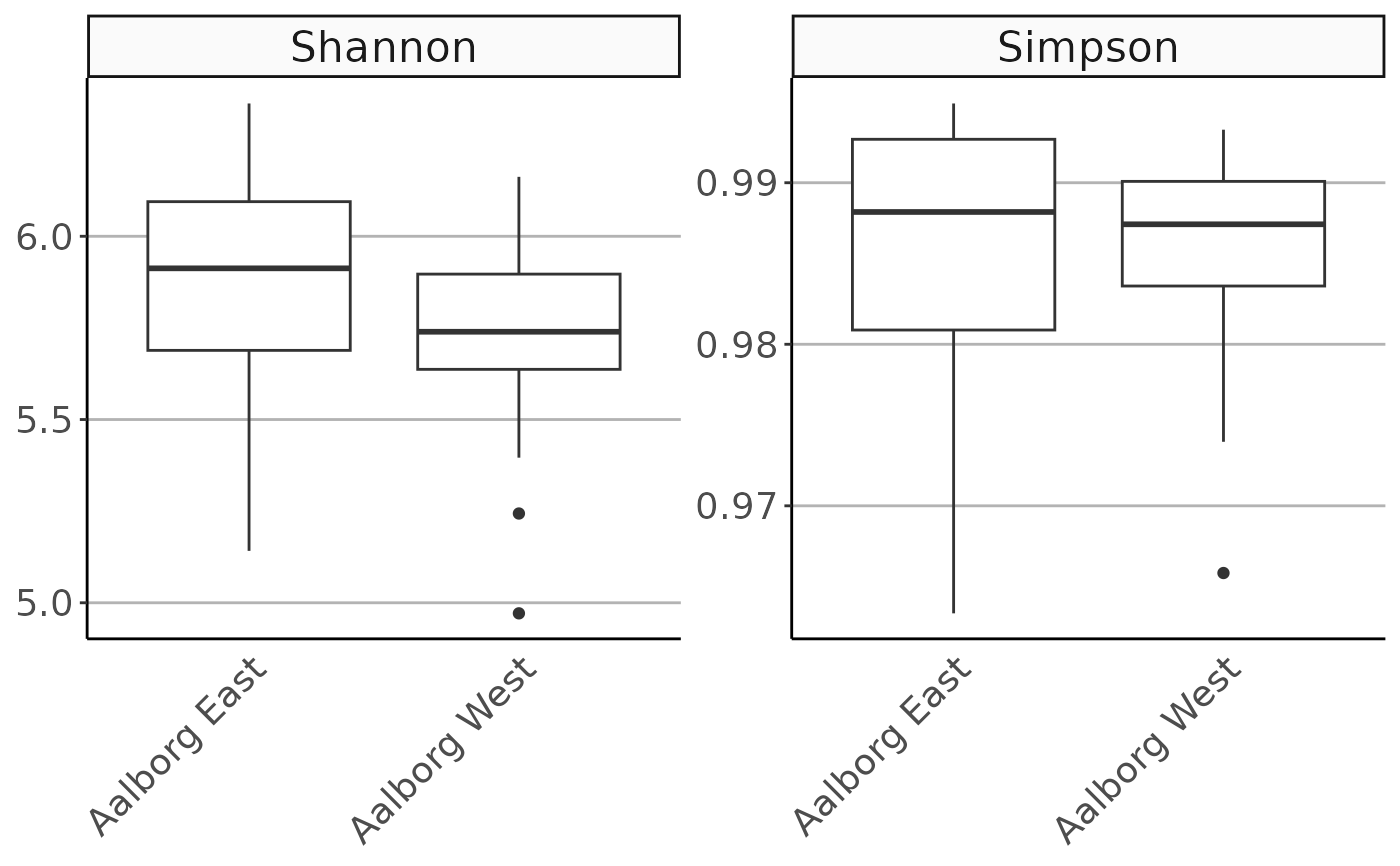
# Generate a plot instead
amp_alphadiv(
AalborgWWTPs,
measure = c("shannon", "simpson"),
rarefy = 20000,
plot = TRUE,
plot_group_by = "Plant"
)
#> The following sample(s) have not been rarefied (less than 20000 reads):
#> 16SAMP-703, 16SAMP-739, 16SAMP-10907