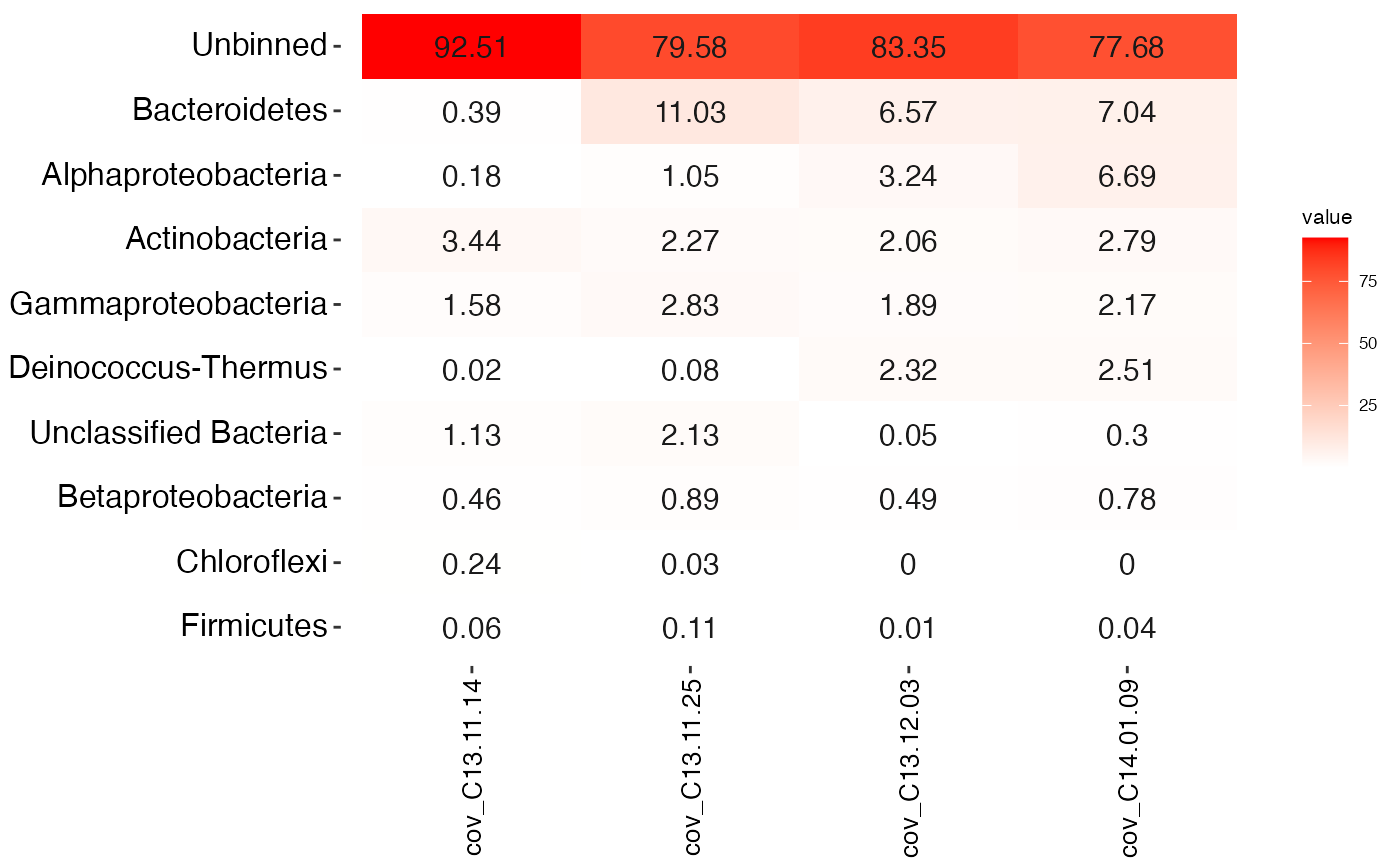
Generates a heatmap of the coverage profiles for the bins.
mmheatmap(mm, CLASSIFICATION = NULL, BIN_COL, TOPN = 20, tax_add = NULL)
Arguments
| mm | (required) A dataframe loaded with |
|---|---|
| CLASSIFICATION | Name of the variable in |
| BIN_COL | (required) Group the scaffolds by a variable in |
| TOPN | Number of the most abundant bins to display. (Default: |
| tax_add | Taxonomic levels to show from the taxonomy variable, one of |
Value
A ggplot object. Note that mmgenome2 hides all warnings produced by ggplot objects.
Author
Kasper Skytte Andersen ksa@bio.aau.dk
Rasmus Kirkegaard rhk@bio.aau.dk
Examples
#> # A tibble: 97,285 x 13 #> scaffold length gc cov_C13.11.14 cov_C13.11.25 cov_C13.12.03 cov_C14.01.09 #> <chr> <dbl> <dbl> <dbl> <dbl> <dbl> <dbl> #> 1 1 8264 57.8 1.44 53.6 0 0.066 #> 2 2 1027 57.0 0.625 24.2 0 0 #> 3 3 1665 55.9 13.5 434. 0.166 0.177 #> 4 4 9056 35.9 0.01 23.4 0 0 #> 5 5 3343 64.0 3.20 16.4 0 0 #> 6 6 98207 39.1 0.00966 24.5 3.29 9.85 #> 7 7 6480 63.0 2.61 19.2 1.46 12.3 #> 8 8 15790 61.7 2.78 21.2 1.62 10.3 #> 9 9 1403 70.4 85.1 192. 0 0 #> 10 10 2018 70.2 50.3 101. 0 0 #> # … with 97,275 more rows, and 6 more variables: PC1 <dbl>, PC2 <dbl>, #> # PC3 <dbl>, geneID <chr>, taxonomy <fct>, rRNA16S <fct>mmheatmap( mmgenome2, BIN_COL = "taxonomy", TOPN = 20 )#> Warning: `select_()` was deprecated in dplyr 0.7.0. #> Please use `select()` instead.#> Warning: `group_by_()` was deprecated in dplyr 0.7.0. #> Please use `group_by()` instead. #> See vignette('programming') for more help#> Warning: `rename_()` was deprecated in dplyr 0.7.0. #> Please use `rename()` instead.#>